If you are involved in large-scale systems change, then you probably recognize that changing a system is about changing the relationships among the different people and parts of the system. Your work is likely to involve identifying who is doing what, and cultivating new relationships between people, to catalyze energy and innovation among networks of organizations and people involved in the issues.
But how do you track these networks and measure the important relationship building work, for funders and others who want to understand the progress you are making? Social Network Analysis (SNA) is being used more and more as a measure of the progress of large-scale systems change networks.
SNA maps are very different from GIS-type maps that show where entities are located geographically. A social network map is a visual representation of our human and social capital — who is doing what; what skills, talents, and assets people bring; who is collaborating with whom; and, how people and organizations are connected to each other.
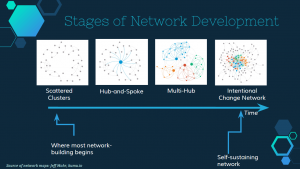
CHECK OUT THIS WEBINAR—Christine and I introduce a new approach to network mapping, which builds on the benefits of classic SNA and has recently become available through the new mapping tools Kumu and sumApp. We discuss how these new tools enable an approach that wasn’t really possible using the old tools, so that the process now is more collaborative, engaging, emergent, transparent, and able to track network development over time. Specifically, we talk about a joint project we undertook, mapping the Appalachian Foodshed Partnership, paying attention to:
- the process of developing these new kinds of network maps
- how the tools made the difference and how they fit together, and
- benefits of this new approach.
Contact me (Tracy) if you would like to talk more about this!
2017.07.25 LLC Webinar Series | Tools for Network Mapping: How SNA maps can transform your work from Leadership Learning Community on Vimeo.